This lab will generate numbers for our “before” case data set. The data used here will used to evaluate process stability and capability, estimate the proportion that is conforming, the proportion that is scrap, and the proportion that can be reworked.
Materials
- Cylinder sample set #3
- Worksheet: DATA COLLECTION LAB
- Gage blocks
- Mitutoyo digital height gage
- Brown & Sharp digital height gage
- Mini scale
- Dial calipers (as needed for additional collection)
- Envelopes to identify samples
Procedure
Zero and calibrate each instrument with gage blocks. Remove a workpiece from the wooden box and put it in an envelope with the workpiece identifier written on it. Be sure to keep samples properly identified.
Part 1
Record
- Workpiece identifier (A1, B2, Etc.)
- Diameter – if class is large, multiple readings
- Length – if class is large, multiple readings
- Weight
Enter the data into either notepad or excel. Choose a format that will make it easy to use the data.
Clean and wipe each workpiece before returning to its appropriate cell in the wooden box.
Analysis
Part 2
- Import the data into a single worksheet in Excel.
- Data should be grouped by column
- Include an index (key) column (values are 0, 1, 2, 3, etc.).
- Make a worksheet to group the data from a selected column into 25 groups of five.
- Use vlookup()
Part 3
- Plot a histogram of all of the data.
- Determine cell interval
- Find cell boundaries
- Round the data in the subgroups
- Use countifs( ) to get frequencies
- Insert a histogram, bars should touch.
- Plot a scatter diagram
- On a separate worksheet, Use vlookup to pull two columns of data.
- You must be able to select the columns
- Pull labels for the columns using vlookup.
- Calculate the correlation coefficient
- Display the best-fit line and equation on the diagram.
- Answer the following question:
- Does the length increase with the diameter?
- Support your answer.
Part 4
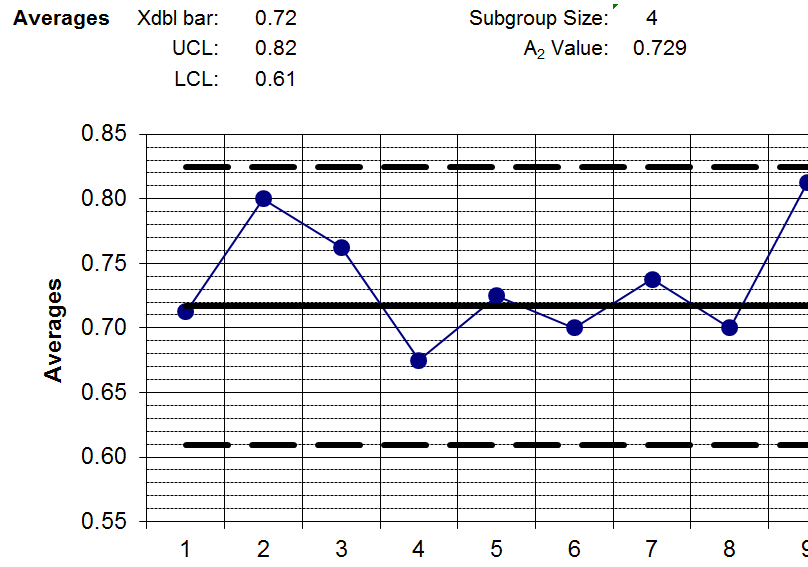
- Plot an Xbar & R Chart
- For each subgroup, calculate the average and range.
- Find X double bar
- Find the average range (R bar)
- Find the UCL and LCL for Xbar and R
- Plot Xbar and R with Central Line (solid) and Limits(dashed)
- Data points should be dark blue dots connected with a thin solid line.